“It is the mark of an instructed mind to rest satisfied with the degree of precision which the nature of the subject admits, rather than to seek exactness when only an approximation of the truth is possible.” [Aristotle, circa 300 BC]. Thank you for hanging in there through Part I and Part II of this series on Tuning SQL Using Feature Engineering and Feature Selection. There are a lot of detail to absorb which takes time and attention; you could just run the code and see what pops out as root cause, but here, I’m attempting to explain the processing under the covers and tie this back to the data science principles that undergird the approach I’m taking. Since performance issues can vary greatly from case to case, traditional methods of root cause analysis can miss important observations due to the limited number of metrics typically instrumented. I characterize the Dynamic Oracle Performance Analytics (DOPA) approach as a step-change paradigm shift away from traditional methods or performance analysis because of the significance of being able to instrument many metrics and flag those whose values are out of normal range; the DOPA process improvement over traditional methods is better suited [in my opinion] to solving any arbitrary performance problem or at the very least giving you quick insights into difficult problems by highlighting anomalies (perhaps exposing features (metric) that you have not looked at before). I truly believe that this method of performance analytics is truly transformative; even if you don’t use this method with hands-on, the concepts covered here may transform the way you think about performance analytics. Here’s what others have said on this approach:
- “Great article! Worked with AWR for nearly a decade, this is a really refreshing perspective. Thanks for sharing.” [Linked in Comment]
- “Love this” [Linked in Comment]
- “Thanks for sharing.. Looks like will be of great help ..” [Linked in Comment]
- “Roger, great to read your write up & sharing of your expertise!” [Linked in Comment]
- The last decade of his career distilled into ten days of learning; this is a deal.
"This book offers UNIQUE MATERIAL you will not find anywhere else. Most books on performance tuning are simply recapitulations of the Oracle manuals. This book is not a recapitulation of the manuals. It is a description of a skill Roger (author) has developed on his own, and which he uses regularly to attack performance problems on Oracle systems."
Kevin Meade December 24, 2018
- "This is an interesting book for experienced Oracle DBAs who are involved in performance tuning to read. ... This methodology does replace the methodologies based on wait analysis."
Doug Hawthorne Reviewed in Australia on February 3, 2019
In prior posts I covered the basics of feature engineering [i.e., creating or transforming data into metrics that can go into the analysis model used to identify performance anomalies], primarily by unpivoting the columns into rows, and performing some calculations on columns, creating Key-Value Pairs (KVP) from many metrics from SQL metrics embedded in Multi-Column-Tables (MST’s) found in Oracle’s Automated Workload Repository (AWR); I also touch on feature selection which is the capability to laser focus in on the metrics that are key influencers in the performance equation. In Part I, I focused on DBA_HIST_SQLSTAT, and in Part II I focused on DBA_HIST_ACTIVE_SESS_HISTORY. The reason I like the KVP structure is that it makes it easier to compare and compute on many-many metrics, thus having a more robust analysis. Further, I can instrument more metrics and extend the analysis a whole lot easier as well using KVP’s instead of MCT.
The Basic Pattern for the DOPA Process
At its core the DOPA process is simple; it compares the metric values encountered in a problem interval for the SQL to the values encountered in an interval when the SQL processing was normal. The metrics values form the problem interval that are outside normal ranges are the anomalies and are shown in priority sorted order in the output you get when running the DOPA process SQL statement [yes, it’s a single SQL statement].
1. Instrument the metrics of interest: This is the feature engineering (unpivoting, calculating values, transforming dates into numeric metrics (e.g. number of seconds since last sample/event)). There is nothing for you to do here unless you want to instrument different/more metrics. I have done this for tens of thousands of metrics in the original DOPA process covered in my book. For SQL-level metrics, I source the metrics from DBA_HIST_SQLSTAT and DBA_HIST_ACTIVE_SESS_HISTORY. This step was covered in Part I and in Part II.
2. Compare good run to a bad run: Here we compare the metrics encountered in a problem interval to the metrics encountered in an interval when the SQL processing was normal (I use a with clause sub-query to calculate the normal ranges). The DOPA SQL statement does the comparison, but your input is needed here (after all you’ll be running this on a problem in a system you help look after). This blog post will cover this step in the process in more detail.
3. Tweak the model: This is done via input conditions to the DOPA SQL statement. For now, accept the default conditions that are used to tweak the model. I’ll cover this in more detail in a future when I review sample executions in detail.
4. Run the model and review the results: AKA run the SQL statement. This can be somewhat of an iterative process, because you may need to change the way you subset the data and have opportunities to tweak the model. Sometimes you get many anomalies flagged, so re-run with different conditions may make the analysis of the anomalies easier. I’ll cover this in more detail, as well, in a future when I review running the model in detail.
As much as I’d like to jump right in and show you how to run the single SQL statement that flags the metrics that are key influencers in the performance problem at hand [steps 3 and 4], I’d like to spend a bit of time in step 2 of the process, which embodies the principles of the datasets we are dealing with and introduce the normal ranges which are used to perform the feature selection (i.e. flag the anomalies in the metric values).
Datasets:
I like to think of the data sets in a few major categories:
Ø All metrics from the problem interval;
Ø All metrics from the normal interval;
Ø All metrics from an interval that encompasses the problem interval and the normal interval;
Ø SQL_ID’s;
Ø Sessions in problem and/or normal interval [optional subsetting].
Problem Interval
Expressed as a date/time range we use this to subset ASH and SQLSTAT data (translating to the snapshot id’s [snap_id] which define the interval). This is custom per analysis, where you set the values of substitution variables used by the SQL statement. This date range
Normal Interval
Also expressed as a date/time range used to subset ASH and SQLSTAT data and calculate normal ranges for the instrumented metrics.
All Intervals
This is used primarily when you run the time-series view to get all the data for a metric. The time-series view is helpful if you want to visualize value trends for a particular metric but not see all the date in the AWR tables.
SQL_ID’s
This is the unique identifiers for the set of SQL statements that you want to analyze [one or many SQL statements].
Sessions
Sometimes it is convenient or necessary to identify individual sessions in either the problem or normal intervals
Normal Ranges
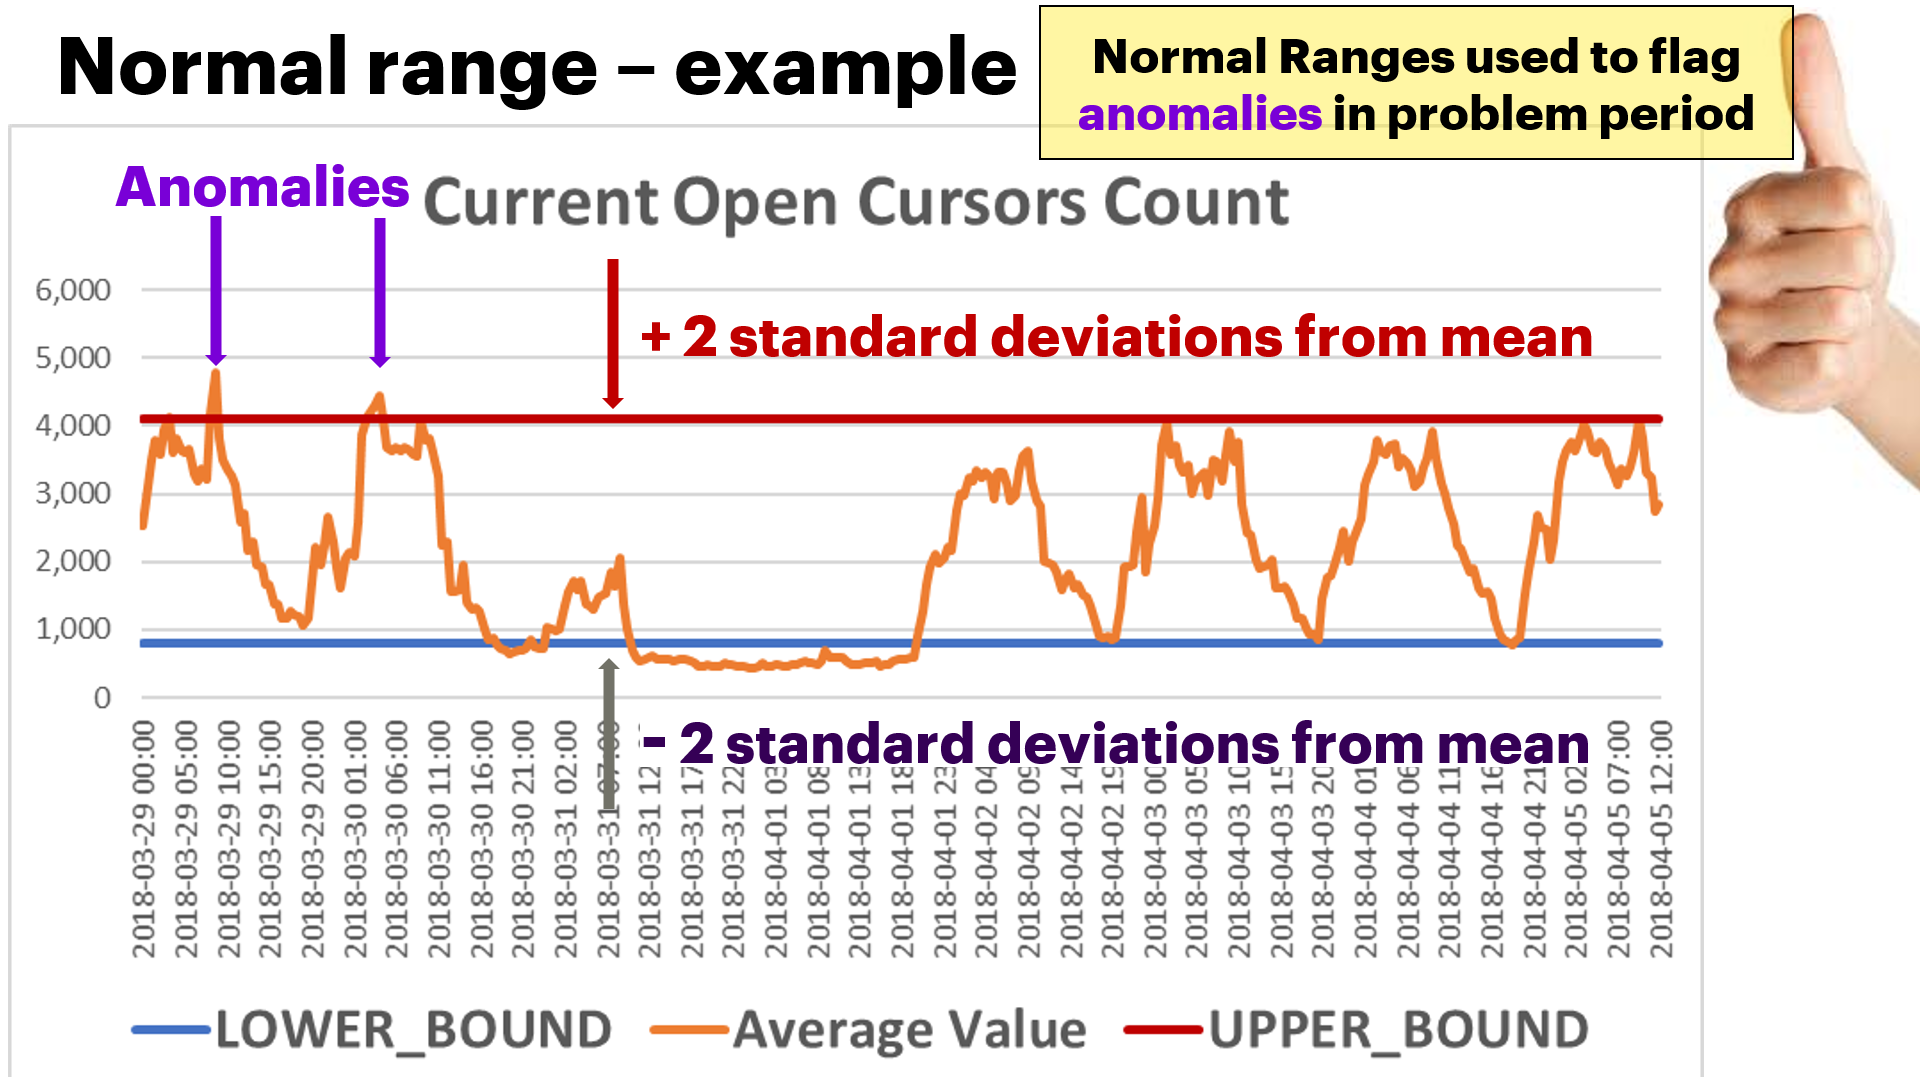
The normal ranges are a concept that needs a little more detailed explanation. Here’s how it works: using a time interval of normal processing for the SQL, calculate the normal ranges using the “rule of thumb” which is plus or minus 2 standard deviations from the mean [since most computer professionals have some statistics in their educational or professional background, I’ll leave it to the reader to look into these statistical terms]. These are computed with out-of-the-box aggregate functions. I’ll show some code later. The following graph illustrates normal ranges pictorially (explained below)
Let me explain the above graph:
· The horizontal axis is the date/time when the metric was measured
· The vertical axis is the value for the metric
· the jagged line (orange) is a time-series graph for the value of the metric Current Open Cursors Count (in this example) when the metric was measured
· the top horizontal line (red) is the upper bound of the normal range (plus 2 standard deviations from the mean)
· the bottom horizontal line (blue) is the lower bound of the normal range
· the anomalies are the peaks above the upper bound of the normal range (I’m ignoring for now values below the lower bound of the normal range as generally low values don’t present themselves as performance problems.
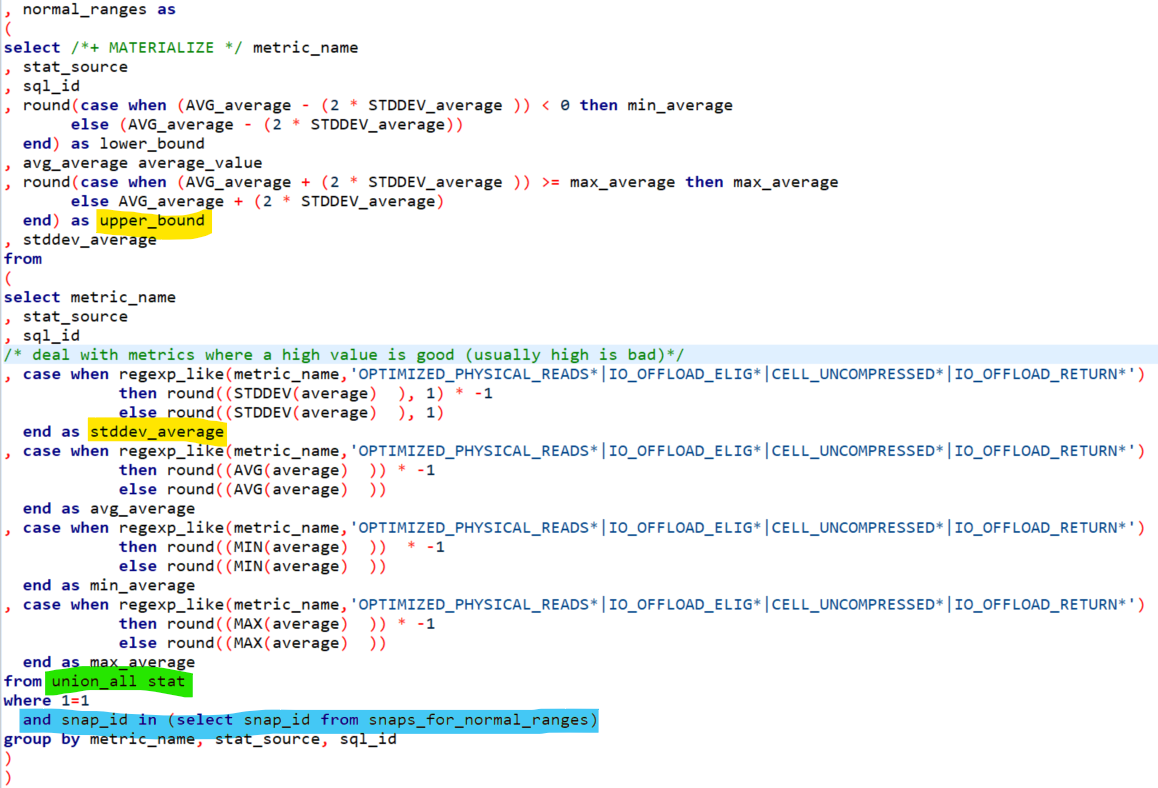
In the DOPA process, I use the normal ranges to setup for the feature selection. Basically, for all instrumented metrics [again, I’ve done this for > 11,000 database level metrics, so this method scales] anything above the upper bound of the normal range is reported as an anomaly. I use a form of one-hot encoding: assigning a 1 of the value is above the normal range and a zero if it is below the normal range. After that, it’s a simple query to report the flagged metrics and their values and order by the metrics with the most anomalies, and how far off from normal the values they were. What follows is the code snippet, rather the actual with clause sub-query I use to calculate normal ranges.
The from clause contains the set of all instrumented metrics and their values from the sub-query “view” union_all_stat (highlighted in green).
I’m subsetting in the where clause on the metrics collected in the snapshot periods for the normal ranges (highlighted in blue).
The standard deviation is computed using the statistical function STDDEV, and the upper bound of the normal range is computed using that standard deviation in a simple mathematical expression (highlighted in yellow).
Next post – Part IV
In the next post I will go through some examples on building the model (i.e. running the SQL statement). I will also go into more detail on the subset parameters in relation to the major data sets including how to set the SQL List; sessions in bad interval; sessions in good interval, etc. Following the basic pattern for the DOPA process described above, that will be steps 3 and 4 [Tweaking the model and Running the model and review the results].

