Introduction
In “Taming the AWR Tsunami 02 – Active Session History” we dove deep into the kinds of questions you can answer using ASH data. In Taming the AWR Tsunami 03 – dba_hist_sqlstat we looked into the hidden secrets for using the SQL metrics found in dba_hist_sqlstat. This time, I hope to unravel how we can troubleshoot Logon Storms and Session Leaking using AWR and other sources.

Logon Storms and Session Leaking – What are they and why do I care?
Logon Storms and Session Leaking in an Oracle database are essentially issues with user sessions. These situations can cause database and application problems, therefore, knowing how to troubleshoot these from the database side can help come up with solutions. The problems can manifest themselves as, connection pool errors, failed logons, and maxed out CPU.
Logon Storms
Logon Storms are sudden spikes in the number of connections. This can result in driving up CPU as the database builds out the memory areas for the sessions; overwhelming the database with active sessions ; connection requests erroring out because there are no more connections available or the system can’t process the requests fast enough.
Session Leaking
Session Leaking is usually associated with sessions being orphaned or not closed properly, resulting in idle “orphaned” sessions in the database and the application not being able to get new active sessions.
What Metrics can be used to troubleshoot Logon Storms and Session Leaking?
There are many metrics in the AWR (Automated Workload Repository) that can be used to help troubleshoot Logon Storms and Session Leaking. I will also introduce a non-AWR source that I go to a lot to help troubleshoot (DBA_AUDIT_TRAIL).
DBA_HIST_SYSMETRIC_SUMMARY
There are 161 valuable metrics from DBA_HIST_SYSMETRIC_SUMMARY (sysmetric summary) that are gathered every snapshot interval. The ones that I’m particularly interested in for troubleshooting logon storms or session leaking are: Session Count, Session Limit %, Current Logons Count, and Logons Per Sec. The metric values are given in sysmetric summary are the actual value for that interval so I don’t need any fancy calculations. For each of the 161 metrics, the sysmetric summary view exposes the minimum value, the average value, and the maximum value [as well as the standard deviation and the sum of squares, which I rarely use]. In the example below, I am pivoting the average values for the metrics of interest as columns; one could easily change this to see the maxval:
select instance_number, snap_id, begin_interval_time, max(case when metric_name = 'Session Count' then average else null end) as "Session Count", max(case when metric_name = 'Session Limit %' then average else null end) as "Session Limit %", max(case when metric_name = 'Current Logons Count' then average else null end) as "Current Logons Count", max(case when metric_name = 'Logons Per Sec' then average else null end) as "Logons Per Sec"from dba_hist_sysmetric_summary natural join dba_hist_snapshotwhere begin_interval_time >= trunc(sysdate)group by instance_number, snap_id, begin_interval_timeorder by snap_id;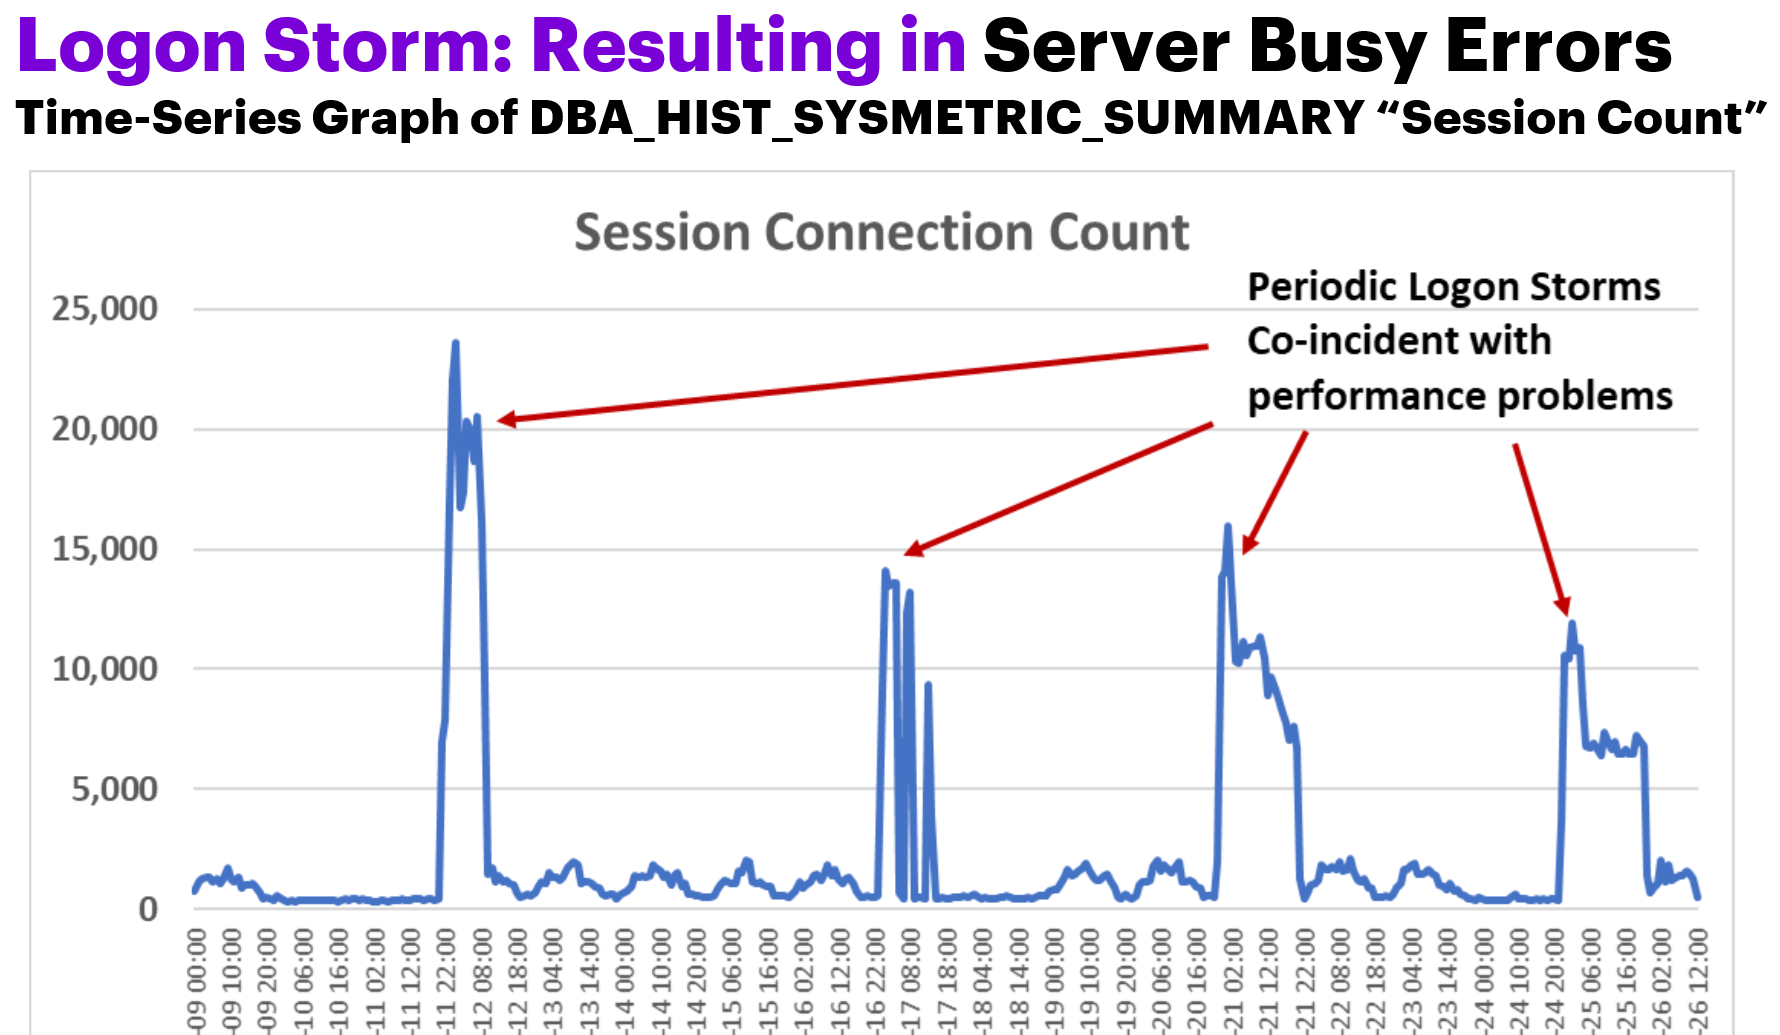
Sometimes with Logon Storms, the CPU goes way up, so you can add to the query checking on the metric_name = ‘Host CPU Utilization (%)’. The graph below was used to monitor the Logon Storm tuning fix using the sysmetric summary metric, ‘Host CPU Utilization (%)’:

DBA_HIST_SERVICE_STAT
In DBA_HIST_SERVICE_STAT (service stat) we find 28 metrics of resource usage recorded for each snapshot on a service-by-service basis. [Side Bar Note: I’ve not found a real good source for the documentation on the metrics found in service stat, however, many of these metrics are found also in v$sysstat, so I recommend looking there and also v$sess_time_model.] This breakdown in granularity of resource consumption by service found in DBA_HIST_SERVICE_STAT is extremely valuable, but sadly, I’ve not seen many DBA’s or developers look here. One trick to remember is that the service stat metric values are recorded as cumulative, therefore calculating the value for that metric in a snapshot interval will be necessary to ease the interpretation; to do this, I use the LAG analytic function as in the SQL below. So the metric (statistic name) that we can use for this id ‘logons cumulative’ which is a count of logons for that service. The services/intervals where there are serilus logon spikes would be the ones to investigate further. The following query can be used as a starting point to get this information from AWR.
-- Logons for a Serviceselect to_char(begin_interval_time, 'YYYY-MM-DD HH24:MI') as begin_interval_time, service_name, snap_id, instance_number, stat_name, value, value - lag(value) over (partition by instance_number, stat_name order by snap_id) delta_valuefrom dba_hist_service_stat natural join dba_hist_snapshotwhere stat_name = 'logons cumulative' and service_name = :service_name and begin_interval_time >= trunc(sysdate) - 2 and instance_number = 1order by 1;
DBA_AUDIT_TRAIL
The view, DBA_AUDIT_TRAIL, is not part of the AWR, but for applications that need to be compliant with the Sarbanes-Oxley Act, or are otherwise auditing logons and logoffs, you can get the logons and logoffs per second for a user. In the example code below, I am evaluating audited logons and logoffs to help detect session leaking:
-- logons and logoffs per second for a userselect to_char(timestamp, 'YYYY-MM-DD HH24:MI:SS') date_time, username, sum(decode(action_name, 'LOGON', 1, 0)) logon_per_sec, sum(decode(action_name, 'LOGOFF', 1, 0)) logoff_per_secfrom dba_audit_trailwhere username = nvl(:username, username) and timestamp >= trunc(sysdate) - nvl(:days_back, 14) and action_name in ('LOGON', 'LOGOFF')group by to_char(timestamp, 'YYYY-MM-DD HH24:MI:SS'), usernameorder by 1;DBA_HIST_SQLSTAT
There are not really any metrics directly related to logon storms in DBA_HIST_SQLSTAT, but I will say from experience there are couple of SYS SQL that process the data in the audit trail. If I see these SYS SQL in the top SQL for a period, I immediately suspect logon storm problems.
Summary:
The blog post series "Taming the AWR Tsunami" I delve into various aspects of Oracle database performance analysis using AWR data. In the third installment of the "Taming the AWR Tsunami" series, I focus on troubleshooting logon storms and session leaking in Oracle databases. I begin by defining these issues and explaining their impact on database and application performance. Logon storms are sudden spikes in connection requests, leading to CPU spikes and connection errors, while session leaking involves improperly closed sessions, resulting in idle sessions and resource consumption.
The post discusses various metrics available in AWR and other sources for troubleshooting these issues. It highlights the importance of metrics like Session Count, Session Limit %, Current Logons Count, and Logons Per Sec from DBA_HIST_SYSMETRIC_SUMMARY for monitoring logon activity and identifying logon storms. Additionally, it introduces DBA_HIST_SERVICE_STAT for tracking resource usage on a service-by-service basis and DBA_AUDIT_TRAIL for auditing logons and logoffs.
The post also provides SQL queries for extracting relevant metrics from these sources, such as querying DBA_HIST_SERVICE_STAT for logons cumulative to detect logon spikes for specific services. It also mentions monitoring for specific SYS SQL statements in DBA_HIST_SQLSTAT, which can indicate logon storm issues.
In conclusion, this post emphasizes the importance of proactively monitoring and troubleshooting logon storms and session leaking to ensure optimal database and application performance. It highlights the use of AWR metrics and other sources to identify and resolve these issues, ultimately improving overall system stability and resource utilization.