Introduction:
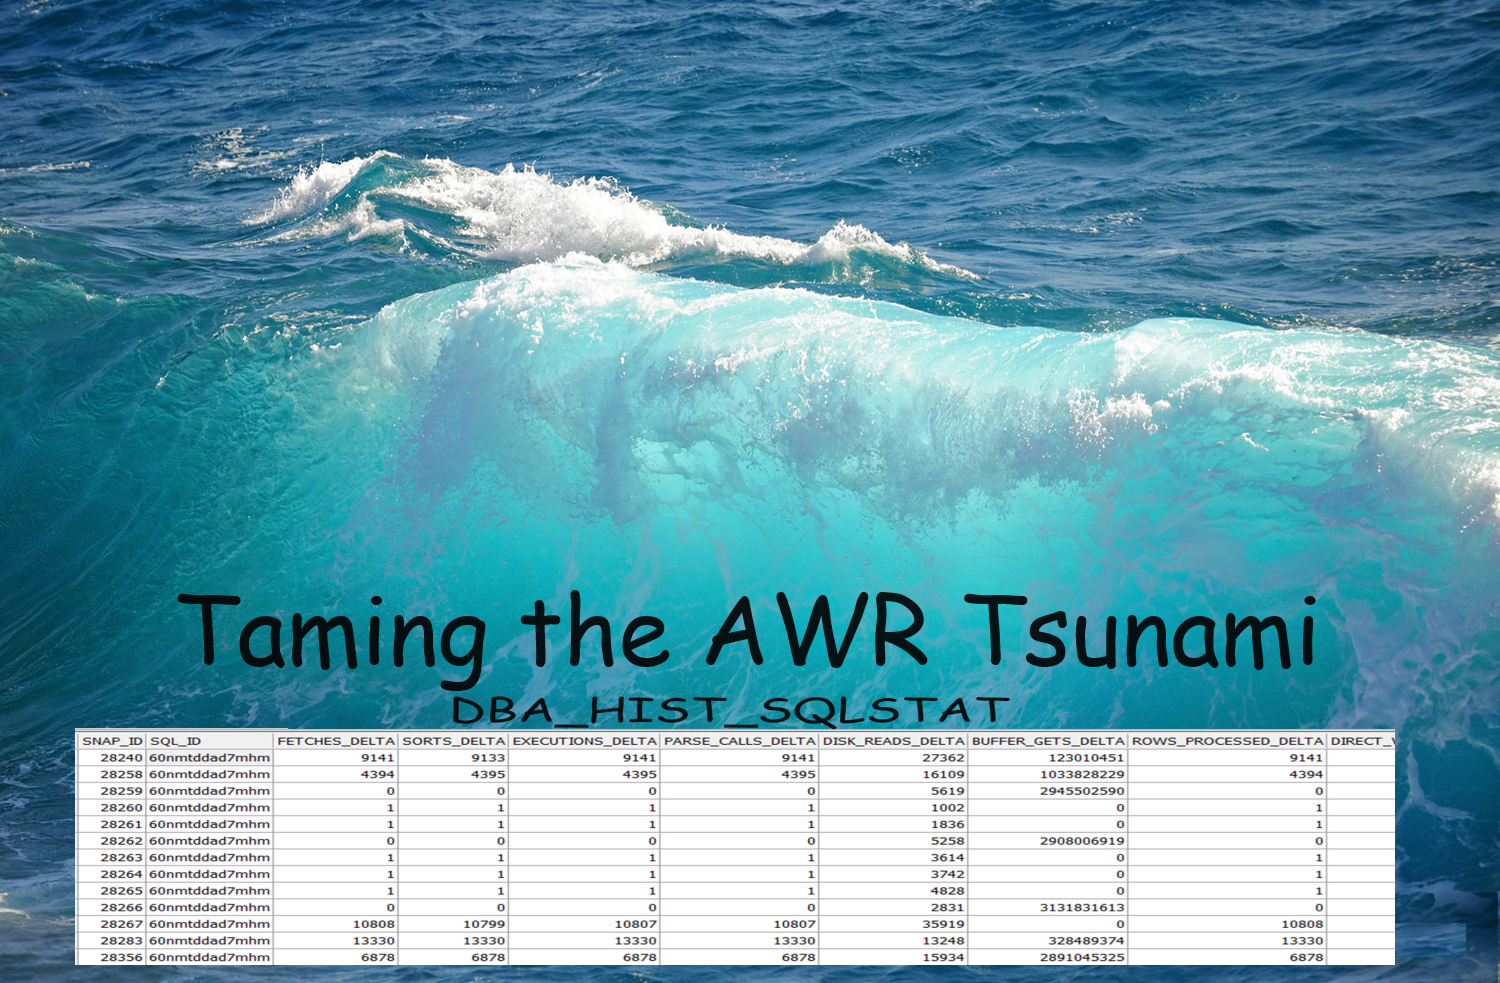
In “Taming the AWR Tsunami 02 – Active Session History” we dove deep into the kinds of questions you can answer using ASH data. This time, I hope to reveal some hidden secrets for using the SQL metrics found in dba_hist_sqlstat (SQLSTAT for short).
DBA_HIST_SQLSTAT is view in Oracle's AWR (Automatic Workload Repository) that contains historical metrics for SQL statements executed in the database. This view captures various metrics for each SQL statement, such as the number of executions, elapsed time, CPU time, buffer gets, and disk reads.
One can use DBA_HIST_SQLSTAT for performance evaluation in several ways:
· Identifying High-Load SQL: By analyzing the metrics in DBA_HIST_SQLSTAT, one can identify SQL statements that are consuming a significant amount of resources, such as CPU, memory, or I/O. This can help in identifying and optimizing resource-intensive queries.
· Tuning SQL Statements Based on Performance Trends: DBA_HIST_SQLSTAT provides valuable insights into the performance of SQL statements over time. By comparing metrics like elapsed time and CPU time for different intervals when the same SQL statement is executed, one can identify performance regressions and thus candidate for tuning. Other metrics like execution count, buffer gets, fetch count, and the various wait classes, DBAs and developer alike can identify trends and patterns in SQL performance, helping them proactively address potential performance issues.
· Comparing SQL Performance: DBA_HIST_SQLSTAT can be used to compare the performance of different SQL statements or different versions of the same SQL statement. This too can help in identifying the most efficient SQL statements and optimizing the less efficient ones. For example, over time, the execution plan for a SQL statement may change (i.e. plan flips). Some plan flips are bad and can easily be spotted using DBA_HIST_SQLSTAT.
Overall, DBA_HIST_SQLSTAT provides valuable historical performance data for SQL statements, allowing DBAs to identify performance bottlenecks, tune SQL statements, and optimize database performance.
Why would my SQL not be persisted in dba_hist_sqlstat?
AWR has a setting for how many of the TOP SQL to persist in dba_hist_sqlstat. This can be set by the dba by a packaged procedure call, for example:
execute dbms_workload_repository.modify_snapshot_settings ( topnsql => 200 );
I have experimented with queries against DBA_HIST_SQLSTAT to see if I can determine the exact number of SQL saved for the Top N SQL, in each interval, but this figure varies wildly. From the doc’s below**, you can see that getting an exact number for the Top N SQL might not be too straight forward. From what I can gather, Oracle will pull the Top N SQL from a number of categories including CPU, elapsed time, parse calls, shared memory usage and version count. Suffice it to say, that on a busy system, lower resource consuming SQL may not make it into DBA_HIST_SQLSTAT.
See example query below where I try to make sense of the Top N SQL statements going into SQLSTAT. I ran this on several databases and it was around 100 SQL’s, sometimes more, sometimes less. I also observed from prior experience that not all SQL captured in SQLSTAT can be found in ASH and vice versa; the query also suggests the same observation.
-- how many of the Top N SQL statements wind up in sqlstat compared to ashwith sqlstat as( -- count of SQL statements recorded in dba_hist_sqlstat by snap_id select snap_id, trunc(begin_interval_time, 'MI') begin_interval_time, count(*) topnsql_count_sqlstatfrom dba_hist_sqlstat natural join dba_hist_snapshotwhere trunc(begin_interval_time) >= trunc(sysdate)group by snap_id, trunc(begin_interval_time, 'MI')), ash as(-- count of SQL statements recorded in dba_hist_active_sess_history by snap_id select snap_id, trunc(begin_interval_time, 'MI') begin_interval_time, count(distinct sql_id||sql_plan_hash_value) topnsql_count_ashfrom dba_hist_active_sess_history natural join dba_hist_snapshotwhere trunc(begin_interval_time) >= trunc(sysdate)group by snap_id, trunc(begin_interval_time, 'MI'))select sqlstat.snap_id, sqlstat.begin_interval_time, topnsql_count_sqlstat, topnsql_count_ashfrom sqlstat, ashwhere sqlstat.snap_id = ash.snap_idorder by sqlstat.snap_id;Also, data is rolled up into DBA_HIST_SQLSTAT from V$SQL during the AWR snapshot. If the SQL statement had aged out of the shared pool during the snapshot, then it would not be present in V$SQL in order to be captured in DBA_HIST_SQLSTAT.
**From the doc’s:
Topnsql [definition]
If [the value is a] NUMBER: Top N SQL size. The number of Top SQL to flush for each SQL criteria (Elapsed Time, CPU Time, Parse Calls, Shareable Memory, Version Count). The value for this setting will not be affected by the statistics/flush level and will override the system default behavior for the AWR SQL collection. The setting will have a minimum value of 30 and a maximum value of 50,000. Specifying NULL will keep the current setting.
If [the value is a] VARCHAR2: Users are allowed to specify the following values: (DEFAULT, MAXIMUM, N), where N is the number of Top SQL to flush for each SQL criteria. Specifying DEFAULT will revert the system back to the default behavior of Top 30 for statistics level TYPICAL and Top 100 for statistics level ALL. Specifying MAXIMUM will cause the system to capture the complete set of SQL in the cursor cache. Specifying the number N is equivalent to setting the Top N SQL with the NUMBER type. Specifying NULL for this argument will keep the current setting.
More on how to use SQLSTAT
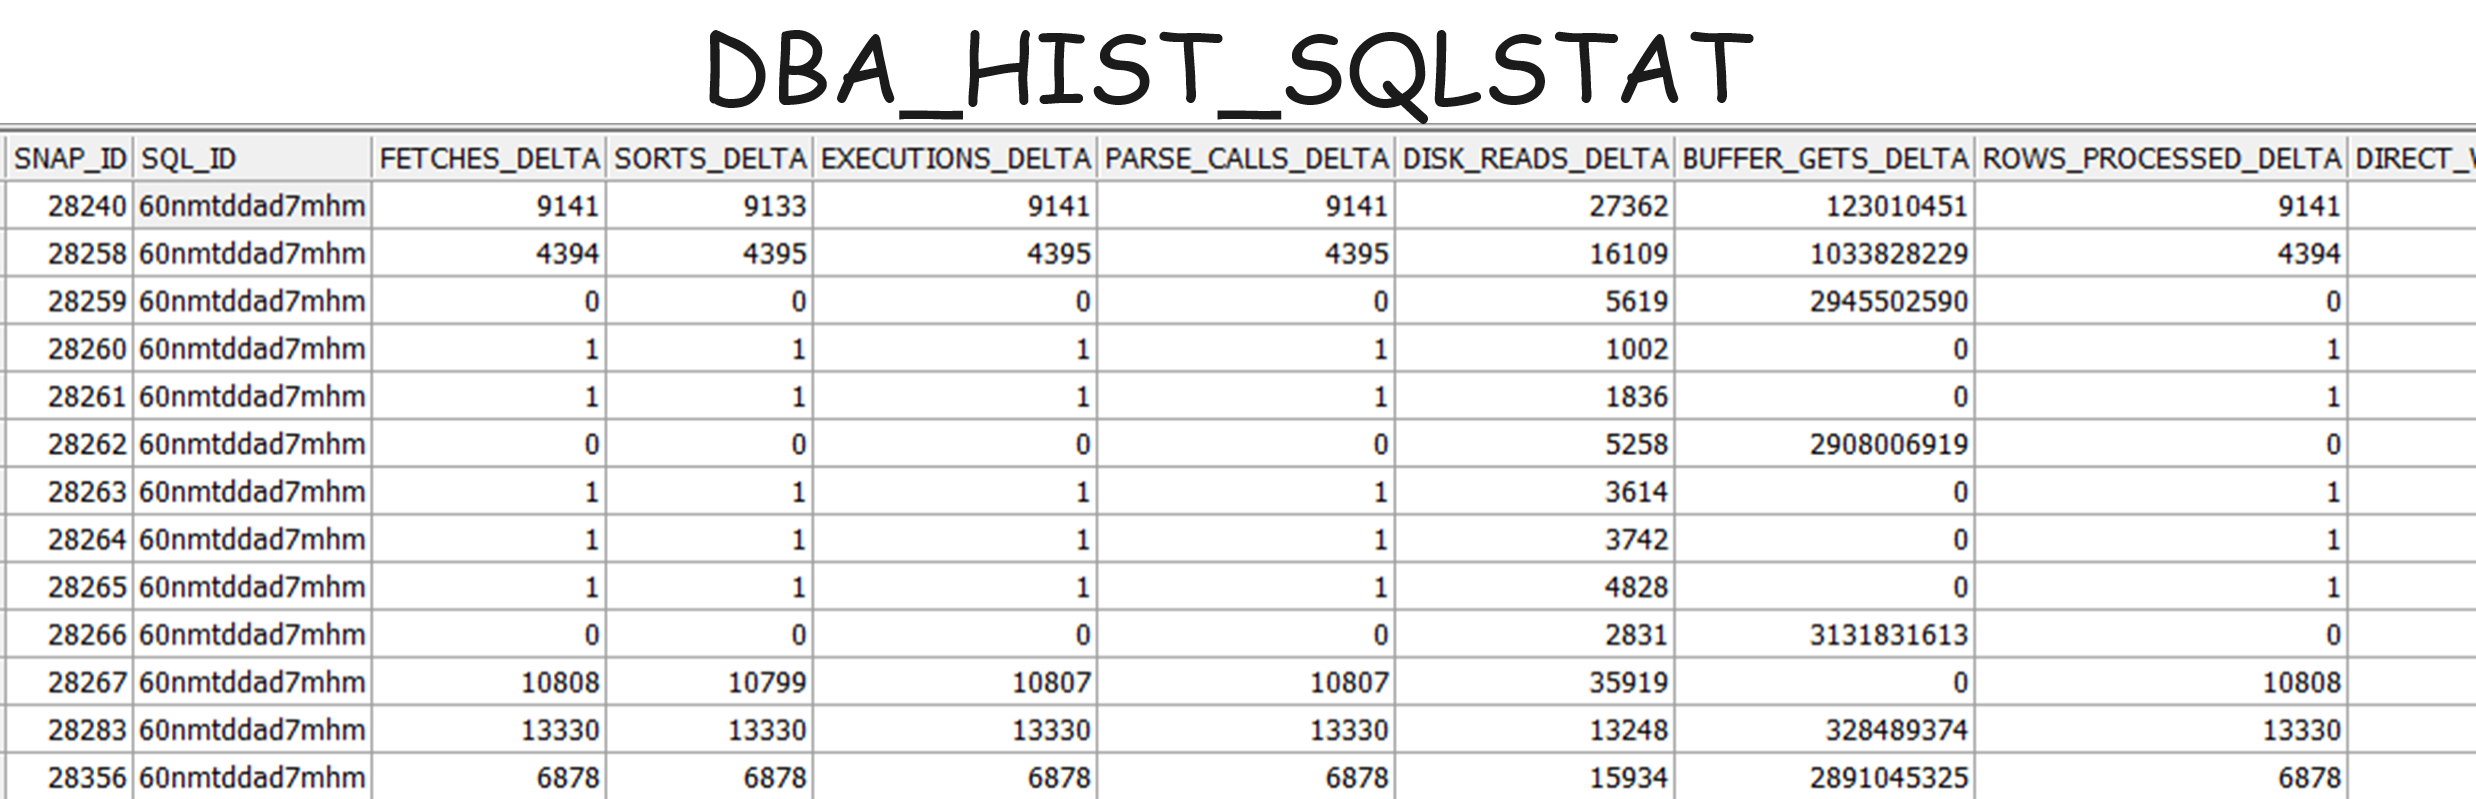
There are a lot of interesting columns of data in SQLSTAT. I primarily focus on the columns ending in “_DELTA”; that’s because the change in the metrics value in the interval (identified by the snap_id) is most helpful in analyzing what is going on with respect to the performance “equation”. For example, DISK_READS_DELTA is more helpful than DISK_READS_TOTAL when trying to understand what happened to a SQL statement in a particular period of time. Likewise, ROWS_PROCESSED_DELTA is going to be more helpful than ROWS_PROCESSED_TOTAL. Each of the _DELTA columns of information tell you something very specific about the execution of the SQL statement in the time interval being evaluated. For the most part the columns are self-explanatory as they are named according to the kind of data they contain, but often the combination of the values in the columns can be used to foster an even better understanding of the performance of the query.
BUFFER_GETS_DELTA
For data that is already in the buffer cache, there will be little physical IO occurring. Therefore, examining buffer_gets_delta in DBA_HIST_SQLSTAT can provide valuable insights into the I/O efficiency of SQL statements [buffer_gets_delta represents the number of buffer gets, which is the number of times Oracle had to access a block in the buffer cache to satisfy a query or DML operation]. For the same SQL statement and multiple execution plans, the plan (identified by plan hash value (PHV)) with a higher value for buffer_gets_delta will be less efficient than the PHV with a low buffer_gets_delta (assuming similar datasets being queried). In this case, we not only use execution time to determine the efficiency of a SQL statement, but also the buffer gets.
PHYSICAL_READ/WRITE_REQUESTS_DELTA and PHYSICAL_READ/WRITE_BYTES_DELTA
Examining PHYSICAL_READ/WRITE_REQUESTS_DELTA and PHYSICAL_READ/WRITE_BYTES_DELTA from DBA_HIST_SQLSTAT can provide insights into the I/O activity of SQL statements. Here's how you can use these metrics in examining SQL performance:
· I/O Intensive SQL: High values of PHYSICAL_READ/WRITE_REQUESTS_DELTA and indicate that a SQL statement is performing a significant number of I/O operations. This can help you identify SQL statements that may benefit from I/O optimization, such as adding indexes or optimizing the query structure itself.
· I/O and Caching Efficiency: If a SQL statement suddenly shows high physical IO, there are a couple of possible root causes. For example:
· Data is not in cache and has to be read in to memory from disk to satisfy the query.
· The particular data mixes for the particular executions in question can be different resulting in more data needing to be read to satisfy the query.
· It is also possible that data fragmentation can cause more IO for a particular SQL statement.
Quick Tip: dba_hist_seg_stat.chain_row_excess_delta or .chain_row_excess_total can give you a quick idea as to which objects have row chaining, which may indicate that the object is a candidate for reorganization.
CPU_TIME_DELTA and ELAPSED_TIME_DELTA together with the %wait_delta columns
Using CPU_TIME_DELTA, ELAPSED_TIME_DELTA, and %wait_delta columns (such as iowait_delta and ccwait_delta) together can provide valuable insights into the performance characteristics of SQL statements and help diagnose performance issues. Here's how you can use these metrics together:
Identifying CPU-Bound and Wait-Bound SQL: By comparing CPU_TIME_DELTA and ELAPSED_TIME_DELTA, you can determine if a SQL statement is CPU-bound or wait-bound. If CPU_TIME_DELTA is close to ELAPSED_TIME_DELTA, the SQL statement is primarily CPU-bound. On the other hand, if ELAPSED_TIME_DELTA is much greater than CPU_TIME_DELTA, the %wait_delta columns can give you a quick perspective on where the SQL statement is waiting.
Analyzing Wait Time Components: %wait_delta columns provide information about the different types of wait events (such as I/O waits or concurrency waits) experienced by a SQL statement [ iowait_delta is the wait time (in microseconds) in the user IO wait class; ccwait_delta is the wait time in the concurrency wait class.] By examining these columns, you can identify the specific wait classes causing delays and focus your tuning efforts accordingly. If you want to know the exact wait events for a SQL statement, you’ll have to look in the active session history. For wait-bound SQL statements, addressing the underlying wait events (e.g., by adding indexes, optimizing I/O operations, or addressing concurrency issues) can help reduce %wait_delta values and improve overall performance.
Monitoring Performance Trends: Tracking CPU_TIME_DELTA, ELAPSED_TIME_DELTA, and %wait_delta columns over time can help you monitor performance trends and identify patterns. Sudden increases in %wait_delta values or discrepancies between CPU_TIME_DELTA and ELAPSED_TIME_DELTA may indicate performance issues that require investigation.
In summary, using CPU_TIME_DELTA, ELAPSED_TIME_DELTA, and %wait_delta columns together can help you identify CPU-bound and wait-bound SQL statements, analyze wait time components, tune SQL statements for improved performance, and monitor performance trends in your database.
ROWS_PROCESED _DELTA along with the FETCHES_DELTA and EXECUTIONS_DELTA
Using ROWS_PROCESSED_DELTA, FETCHES_DELTA, and EXECUTIONS_DELTA together can provide insights into the efficiency and effectiveness of SQL statements. Here's how you can use these metrics in examining SQL performance using DBA_HIST_SQLSTAT:
Efficiency of SQL Statements: Comparing ROWS_PROCESSED_DELTA with FETCHES_DELTA can help you understand how efficiently a SQL statement is retrieving and processing rows. A low FETCHES_DELTA value relative to ROWS_PROCESSED_DELTA may indicate too small of an array fetch size which can introduce too many SQL*Net round trips and thus network bottleneck when there is significant network latency.
Execution Frequency: EXECUTIONS_DELTA indicates the number of times a SQL statement has been executed. By comparing EXECUTIONS_DELTA with ROWS_PROCESSED_DELTA, you can determine the average number of rows processed per execution, providing insights into the effectiveness of the SQL statement.
In summary, using ROWS_PROCESSED_DELTA, FETCHES_DELTA, and EXECUTIONS_DELTA together can help you assess the efficiency and effectiveness of SQL statements, identify inefficient queries, and optimize SQL performance in your database.
Conclusion and What’s next?
While dba_hist_sqlstat is a rich source of information, there is much more in the AWR [over 150 DBA_HIST% tables last I counted]; I hope that I have whet your appetite for further exploration. As William Butler Yates put it: “Education is not the filling of a bucket, but the lighting of a fire.” In future posts I hope to continue to stimulate your interest in diving deep into AWR metrics and help you better understand how you can use these views for evaluating the performance and scalability of an Oracle database workload and thereby help you tame the AWR tsunami.